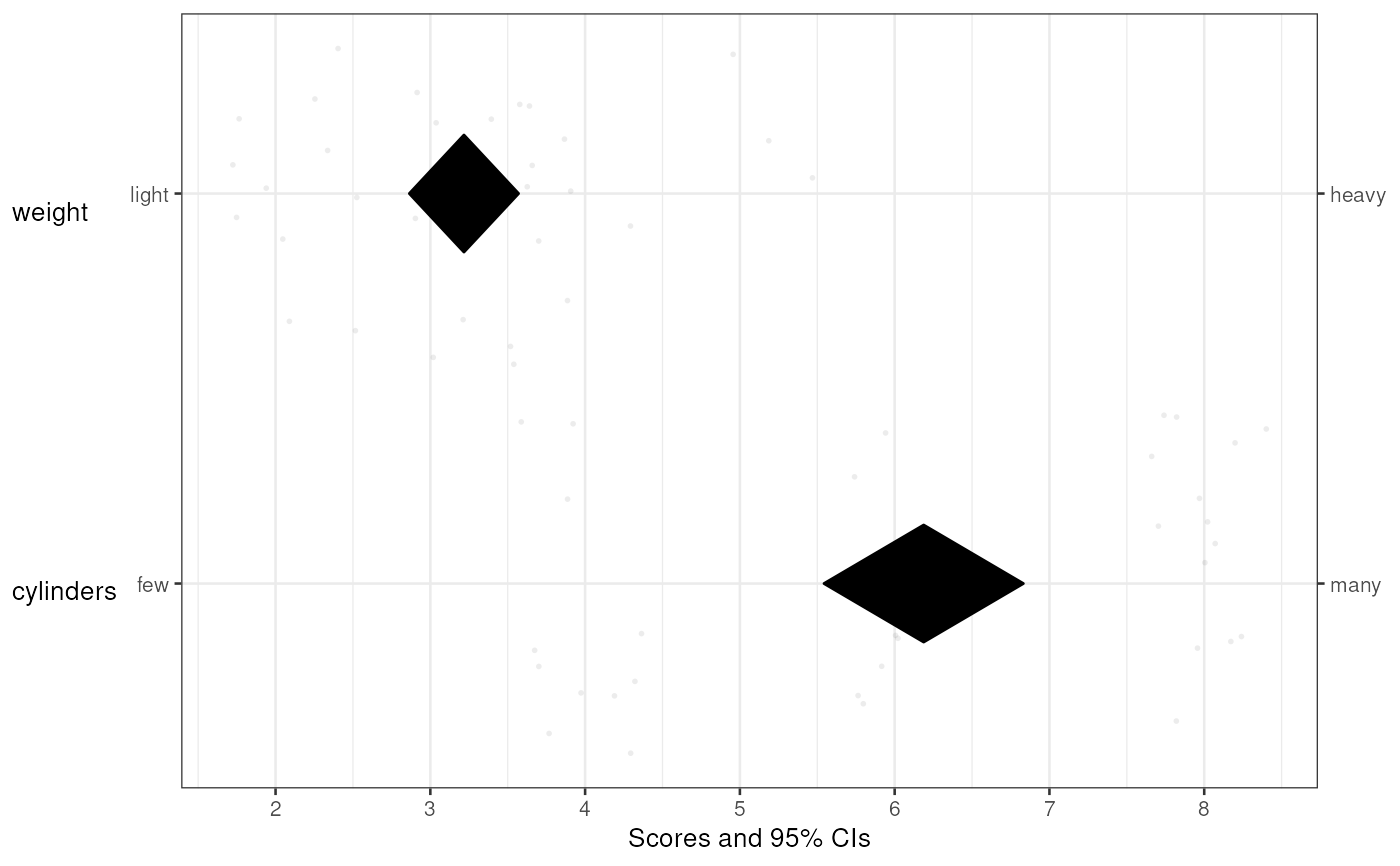
This is basically a meansDiamondPlot(), but extended to allow
specifying subquestions and anchors at the left and right side. This is
convenient for psychological questionnaires when the anchors or dimensions
were different from item to item. This function is used to function the left
panel of the CIBER plot in the behaviorchange package.
biAxisDiamondPlot(
  dat,
  items = NULL,
  leftAnchors = NULL,
  rightAnchors = NULL,
  subQuestions = NULL,
  decreasing = NULL,
  conf.level = 0.95,
  showData = TRUE,
  dataAlpha = 0.1,
  dataColor = "#444444",
  diamondColors = NULL,
  jitterWidth = 0.45,
  jitterHeight = 0.45,
  xbreaks = NULL,
  xLabels = NA,
  xAxisLab = paste0("Scores and ", round(100 * conf.level, 2), "% CIs"),
  drawPlot = TRUE,
  returnPlotOnly = TRUE,
  baseSize = 1,
  dotSize = baseSize,
  baseFontSize = 10 * baseSize,
  theme = ggplot2::theme_bw(base_size = baseFontSize),
  outputFile = NULL,
  outputWidth = 10,
  outputHeight = 10,
  ggsaveParams = ufs::opts$get("ggsaveParams"),
  ...
)
Arguments
- dat
The dataframe containing the variables.
- items
The variables to include.
- leftAnchors
The anchors to display on the left side of the left hand panel. If the items were measured with one variable each, this can be used to show the anchors that were used for the respective scales. Must have the same length as
items.- rightAnchors
The anchors to display on the left side of the left hand panel. If the items were measured with one variable each, this can be used to show the anchors that were used for the respective scales. Must have the same length as
items.- subQuestions
The subquestions used to measure each item. This can also be used to provide pretty names for the variables if the items were not measured by one question each. Must have the same length as
items.- decreasing
Whether to sort the items. Specify
NULLto not sort at all,TRUEto sort in descending order, andFALSEto sort in ascending order.- conf.level
The confidence levels for the confidence intervals.
- showData
Whether to show the individual datapoints.
- dataAlpha
The alpha level (transparency) of the individual datapoints. Value between 0 and 1, where 0 signifies complete transparency (i.e. invisibility) and 1 signifies complete 'opaqueness'.
- dataColor
The color to use for the individual datapoints.
- diamondColors
The colours to use for the diamonds. If NULL, the
generateColorsargument can be used which will then be passed todiamondPlot().- jitterWidth
How much to jitter the individual datapoints horizontally.
- jitterHeight
How much to jitter the individual datapoints vertically.
- xbreaks
Which breaks to use on the X axis (can be useful to override
ggplot()'s defaults).- xLabels
Which labels to use for those breaks (can be useful to override
ggplot()'s defaults; especially useful in combination withxBreaksof course).- xAxisLab
Axis label for the X axis.
- drawPlot
Whether to draw the plot, or only return it.
- returnPlotOnly
Whether to return the entire object that is generated (including all intermediate objects) or only the plot.
- baseSize
This can be used to efficiently change the size of most plot elements.
- dotSize
This is the size of the points used to show the individual data points in the left hand plot.
- baseFontSize
This can be used to set the font size separately from the
baseSize.- theme
This is the theme that is used for the plots.
- outputFile
A file to which to save the plot.
- outputWidth, outputHeight
Width and height of saved plot (specified in centimeters by default, see
ggsaveParams).- ggsaveParams
Parameters to pass to ggsave when saving the plot.
- ...
These arguments are passed on to diamondPlot].
Value
Either just a plot (a gtable::gtable() object) or an object with
all produced objects and that plot.
Details
This is a diamondplot that can be used for items/questions where the anchors
of the response scales could be different for every item. For the rest, it
is very similar to meansDiamondPlot().
See also
CIBER() in the behaviorchange package, associationsDiamondPlot()